The Size & Growth of the Basketball Market
This guest post came through our Article Submission Program. Thoughts and opinions are those of the author.
Introduction
7 Visuals Showing Size & Growth In Basketball Card Market

Basketball card collectors get a lot of their cards graded by PSA (and other grading companies). Every year tens, even hundreds of thousands of cards get sent in for grading.
It’s possible to track the history and health of the basketball market by looking at the PSA POP data to see which cards, sets, brands, and years are the most graded.
This article visualizes 70 years of basketball cards using the PSA population data in various ways to better see the trends, changes, and growth over the years.
List Of Visuals
- Total Basketball Card Market by Year & Brand
- Grade Distribution By Year: % of Total Per Year
- Grade Distribution By Year: Number Per Year
- Market Share by Year: Panini vs Topps vs Fleer
- Number of Sets vs Population by Year
- Most Graded Basketball Card Sets of All Time
- Most Graded Basketball Card Set Each Year
Total Basketball Cards Graded By Year And Brand
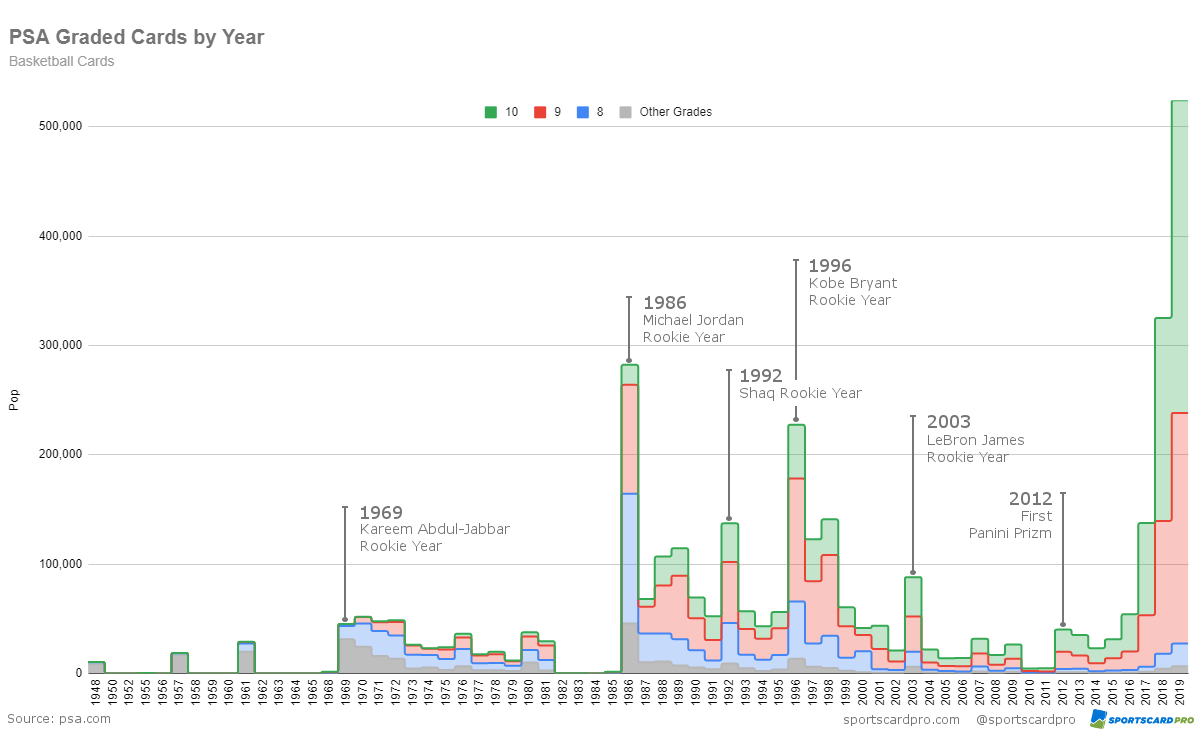
The below chart shows the basketball card market since the first Topps set in 1969 until 2019.
The overall height of the data represents the number of cards graded that year. The different colors are the major basketball card brands. So you can see the overall market trends and how each brand has ebbed and flowed over time too.
The notes in the chart explains noteworthy events and how they changed the basketball card market. Major rookies like Michael Jordan, brands entering the market, or new sets all have an impact on the overall market.
The chart makes it easy to see the growth of basketball card grading since Panini re-entered the market in 2012. From 2011 to 2019, the number of basketball cards graded per year has increased 12,800%.
Basketball Cards Graded by Year and Brand
See Full Sized Chart
PSA Grade Distribution By Year: % Total Per Year
As grading has become more popular, collectors have started sending in their cards for grading right after opening them. Gone are the days of dinging up the corners or putting greasy fingers on the front. With this change the PSA grade distribution has drastically changed too.
PSA 10 was only 5-10% of all cards released in the 70’s and 80’s. After 1986, the PSA 10 share has steadily increased. The number of cards getting PSA 10 has jumped to more than half of all submissions.
Almost 90% of cards graded in 2019 received PSA 9 or better.
How will this impact card prices in the future? PSA 10 will no longer be as rare as it once was. Will collector’s continue to pay big premiums for top grades if they aren’t as rare?
Percent of Cards Getting A Particular Grade By Year
[adcards]
Grade Distribution By Year: Total Population
Not only has grade distribution shifted towards PSA 9 and 10, the total population of cards has shifted higher.
Virtually all of the recent growth in PSA grading has occurred at PSA 9 and PSA 10. PSA 8 and other grades haven’t even reached their 1980’s peaks.
You can see spikes in population in 1986, 1996, and 2003. The rookie years for Michael Jordan, Kobe Bryant, and LeBron James respectively.
Total Number of Cards Getting A Particular Grade By Year
Panini Vs Topps Vs Fleer: Percentage Of Graded Cards By Year
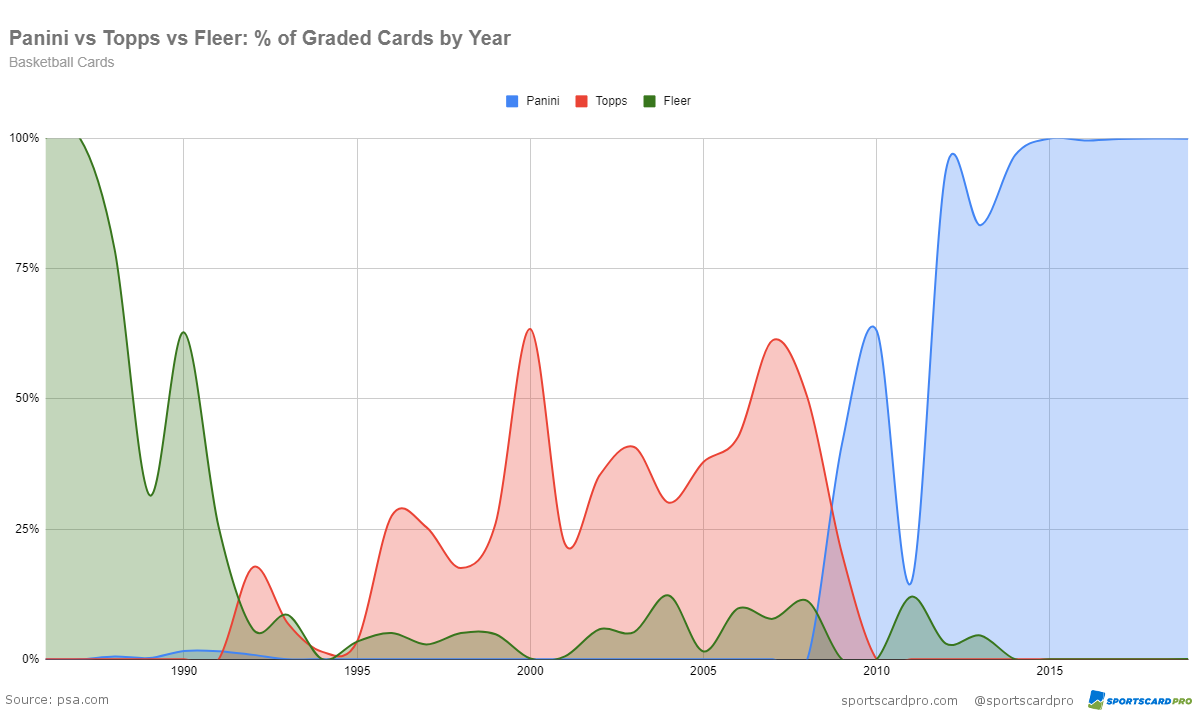
The basketball card brand favored by collectors has changed drastically over time. Right now, Panini is virtually the entire graded card market with only a few sets from other companies being released. Fleer was the favorite of collectors though in the late 1980’s.
See how the graded market share has changed since 1986 until today.
Market Share by Year: Panini vs Topps vs Fleer
Number Of Sets Per Year Vs Total Population
You can see the rise, crash, and rise again in the sports card market in this chart.
Before the 1980’s only a handful of a sets were released each year – Topps and regional/food branded cards. As the hobby grew in popularity manufacturers released more and more sets. But the number of cards that people thought were worth grading was gradually declining.
By the 2000’s the number of sets was on the decline as the number of graded cards reached a low of roughly 5,000 in 2010 and 2011.
In 2012 Panini released their first Panini Prizm set along with many parallel sets. The total number of sets jumped back up to more than 500 in 2019, while the population skyrocketed at the same time.
Number of Sets vs Card Population
Most Graded Basketball Card Sets Of All Time
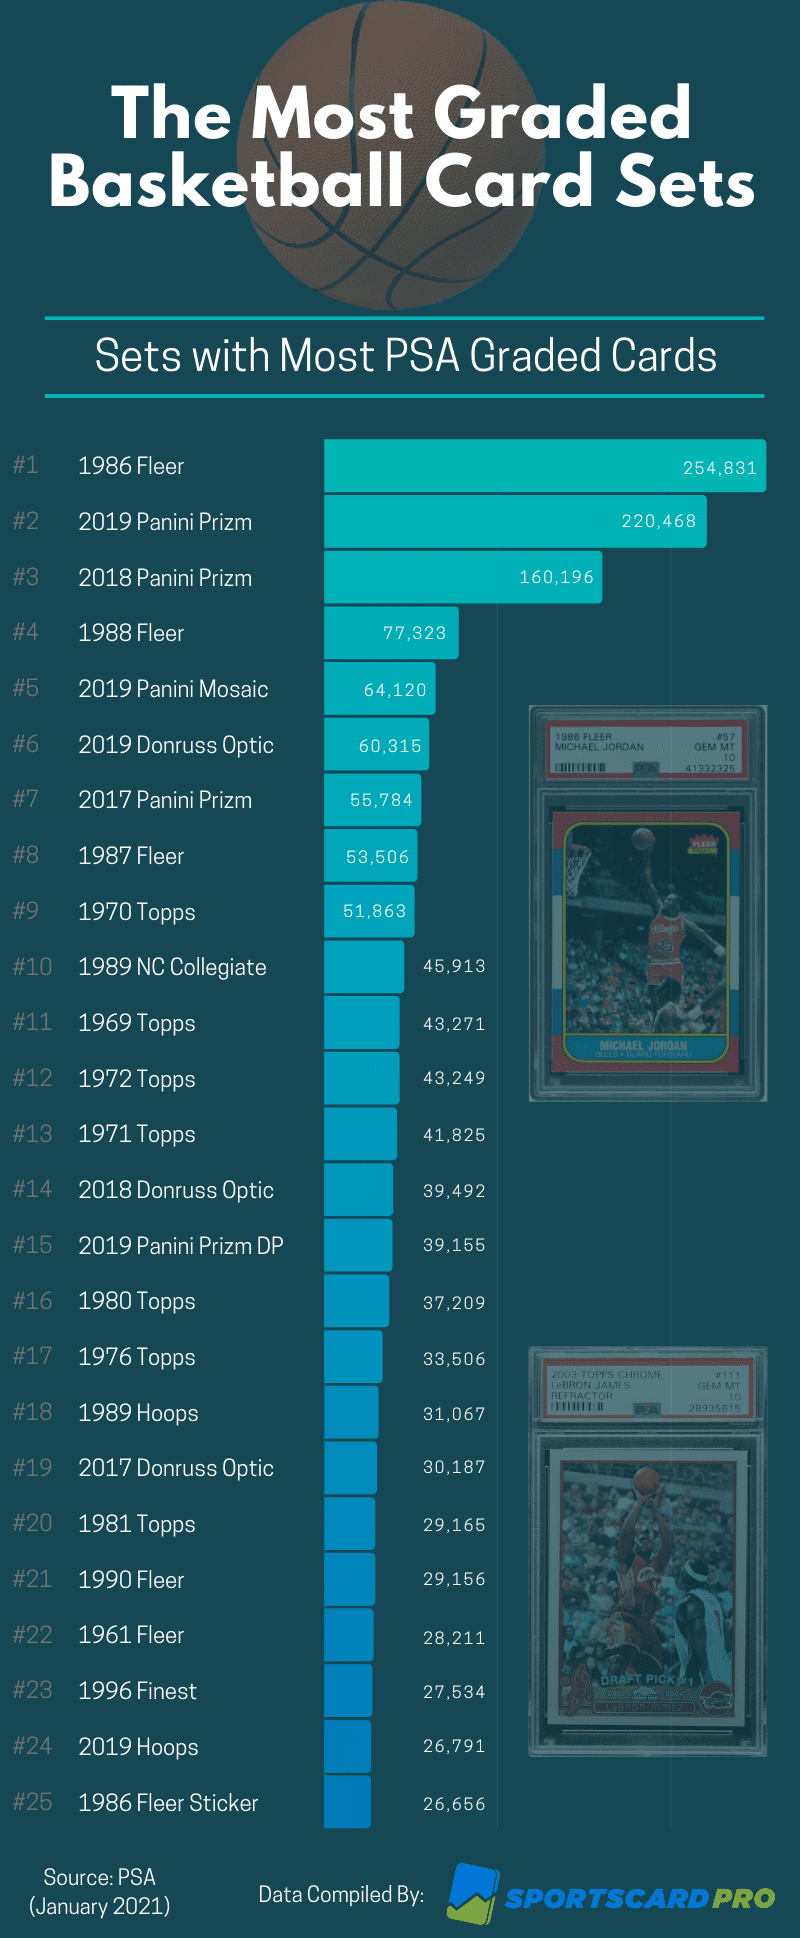
A list of the basketball card sets with the highest overall PSA population. These are the sets that collectors favor the most.
The list is dominated by recent Panini sets and 1986 Fleer set with Michael Jordan and many other top player’s rookie cards.
Most Graded Basketball Sets of All Time
Most Graded Basketball Card Set Each Year
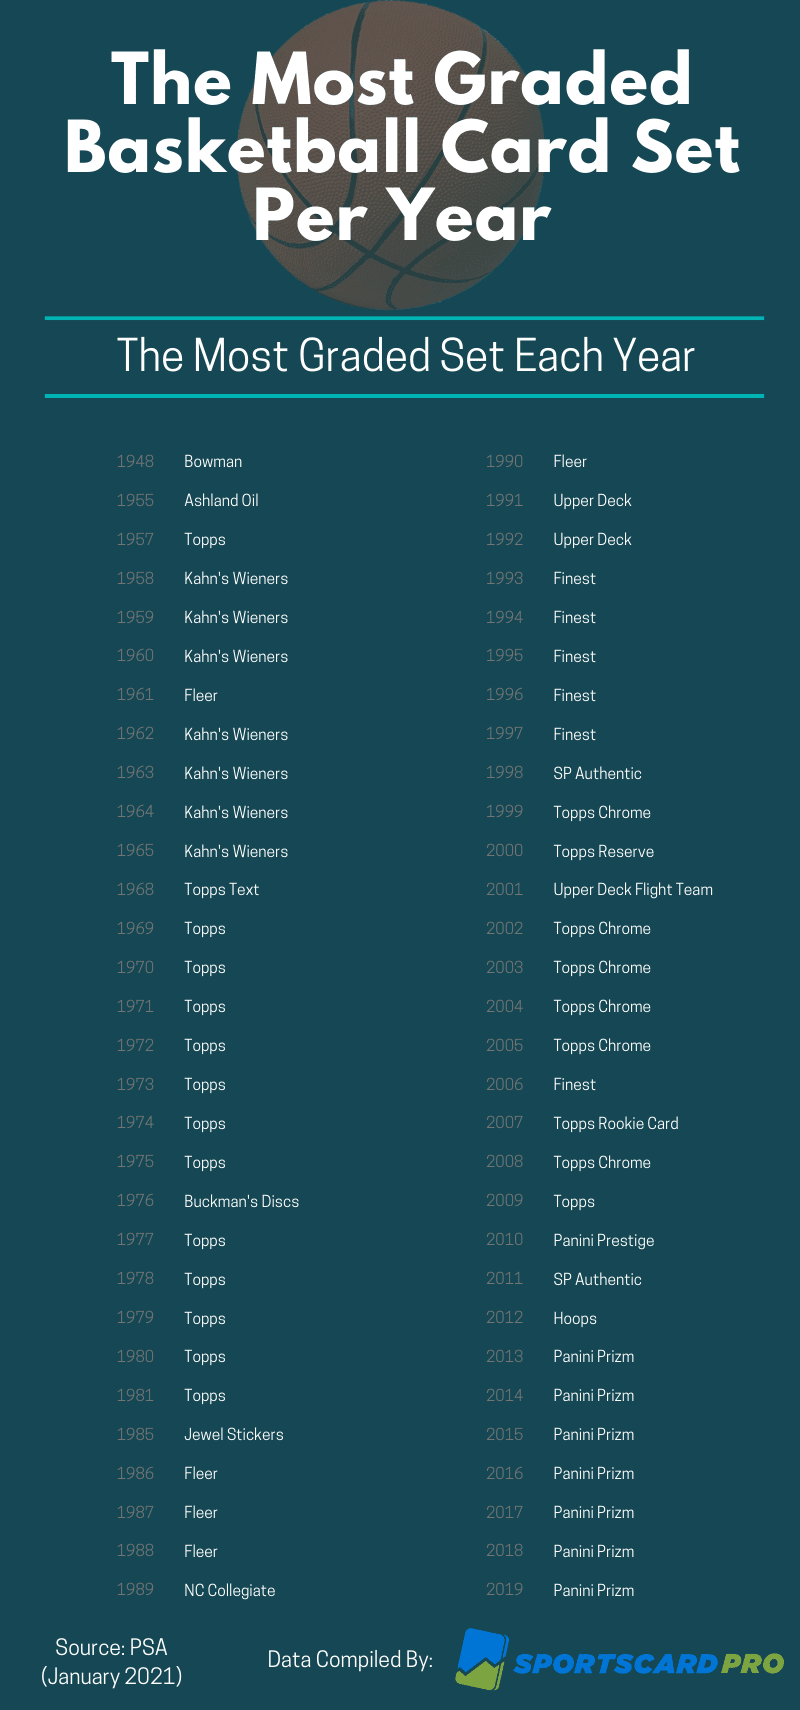
A chronological list of the most graded set per year. This is the basketball card set with the most PSA graded cards that year.
Topps was the most popular set the most times, with other brands leading the pack for a little while until they were dethroned by another popular set.
Panini Prizm has been the most popular set since 2013 (seven years), which ties Topps for the longest streak with the most popular set with basketball card graders. Unless something crazy happens, Panini Prizm should take that crown after 2020 set.
Most Graded Basketball Set Per Year
Conclusion
This was an excellent article filled with visual aids that allow you to see the growth, distribution and graded cards in the basketball market. You can check out more data like this compiled by JJ and our friends at Sportscardpro.com
This article was a great example of significant research and time that many of you put into the hobby to maximize your investments/collections. We appreciate our friends at SportscardPro.com and JJ for the work on these graphs. Do you have any examples of charts, spreadsheets, graphs, or any other data that helps you maximize your profit? If so, we would love to hear from you!
Ready to take your sports card investing to the next level? Join our Membership Program now for card picks, analytics, premium community access and much more!


